15% of South Africa’s Wealth is in the Hands of just 3,500 People, Study Finds
Just 3,500 people – 0.01% of the population – own 15% of total wealth in South Africa, according to a new study. And, there has been no decrease in wealth inequality in the 26 years since democracy. South Africa is one of the most unequal countries in the world in terms of wealth, according to […]

Just 3,500 people – 0.01% of the population – own 15% of total wealth in South Africa, according to a new study. And, there has been no decrease in wealth inequality in the 26 years since democracy.

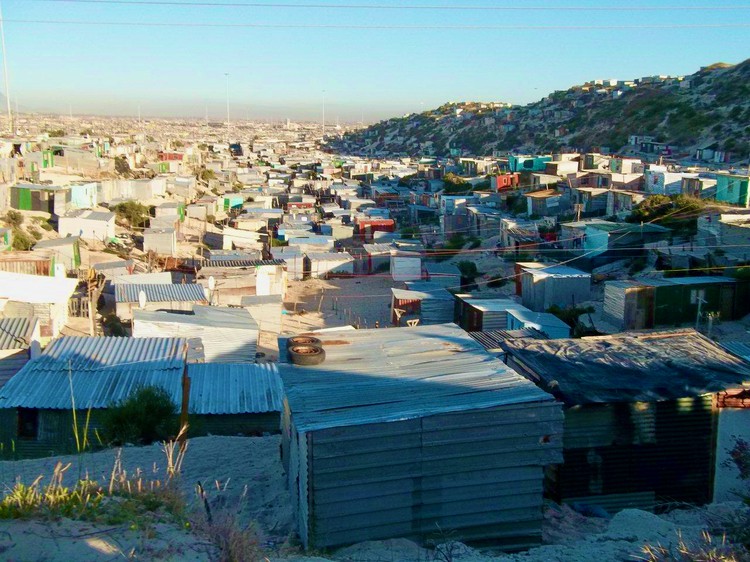
South Africa is one of the most unequal countries in the world in terms of wealth, according to the preliminary findings of a paper by Aroop Chatterjee, Léo Czajka, and Amory Gethin. Chatterjee is at Wits University’s Southern Centre for Inequality Studies, Czajka is at the Université Catholique de Louvain in Belgium, and Amory Gethin is at the World Inequality Lab based at the Paris School of Economics.
Presenting their paper Measuring the distribution of household wealth in South Africa at the University of Cape Town on 4 March, Gethin described the novel methods he and his co-authors used to calculate wealth distribution, a notoriously elusive quantity, and showed that wealth inequality in South Africa not only greatly exceeds income inequality, but has not declined since 1994.
Their preliminary findings show a steep pyramid of wealth:
- The top 10% (3.5 million people) control 86% of all wealth
- The top 1% (350,000 people) control 55% of all wealth
- The top 0.1% (35,000 people) control 29% of all wealth
- The top 0.01% (3,540 people) control 15% of all wealth
- The bottom 90% (31,8 million people) control 14% of all wealth
By contrast, due to their debt, the bottom 50%, or 17.7 million people, have an average negative net wealth of -R16,000.
Economists have typically relied on income inequality when attempting to describe economic inequality within a country. Incomes are most often understood as the money people receive from their employers or from contracts, but income can also come from dividends from stocks, rentals, or other compensation, such as court settlements. Income inequality is an important factor, reflecting the flow of money to different people.
Inequality of wealth, in contrast to inequality of income, became the focus of economists partly as a response to Thomas Piketty’s Capital in the Twenty-First Century. This work described how the incomes of the top 1% of people in the world had been growing at a much higher rate than the bottom 99% since the 1980s.
But the focus on income (rather than wealth) has shortcomings, as Chatterjee, in a 2019 paper, pointed out: “Those with a higher starting level of wealth are able to build wealth quicker than those with lower or no wealth to begin with, leading to increasing wealth inequality.”
The trouble for economic researchers is that wealth controlled by a person or people is difficult to quantify. Wealth hides in plain sight. Unlike income, which is more easily captured by tax statistics, economists cannot easily observe wealth directly.
Leaks such as the Panama Papers revealed a glimpse of the labyrinths used by the elite to keep wealth from view of governments and others.
In recent years, a number of measures of South Africa’s wealth distribution have emerged.
A 2016 study by Anna Orthofer suggested that 1% of the South African population owns at least half of all wealth, and the top 10% owned up to 99% of all wealth. By comparison, Victor Sulla and Precious Zikhali’s 2018 World Bank report “Overcoming Poverty and Inequality in South Africa”, suggests that the top 10% of households account for 71% of household net wealth.
But Orthofer’s study did not account for home ownership, and made strong assumptions about pensions, and so her study tended to overestimate inequality, say Chatterjee, Czajka, and Gethin. Sulla and Zikhali’s calculations, on the other hand, tended to underestimate inequality because they relied on survey data, which often does not tend to capture the wealth of the elite.
Chatterjee, Czajka, and Gethin’s tried to bridge the gap between macroeconomic data (for the economy as a whole) and microeconomic data (for individual actors within an economy).
Where necessary they used flows of income such as interest income or dividends, to establish the capital that lies behind these flows – a process called “income capitalisation”. Though they say the method is not foolproof, partly because as much as 50% of South Africa’s bonds and corporate shares is estimated to be hidden in trusts, their work corrects for many of the usual traps that can lead to over- or under-estimation of wealth.
Extending their method backwards to 1993 shows that wealth inequality has remained at largely the same level, or increased slightly.
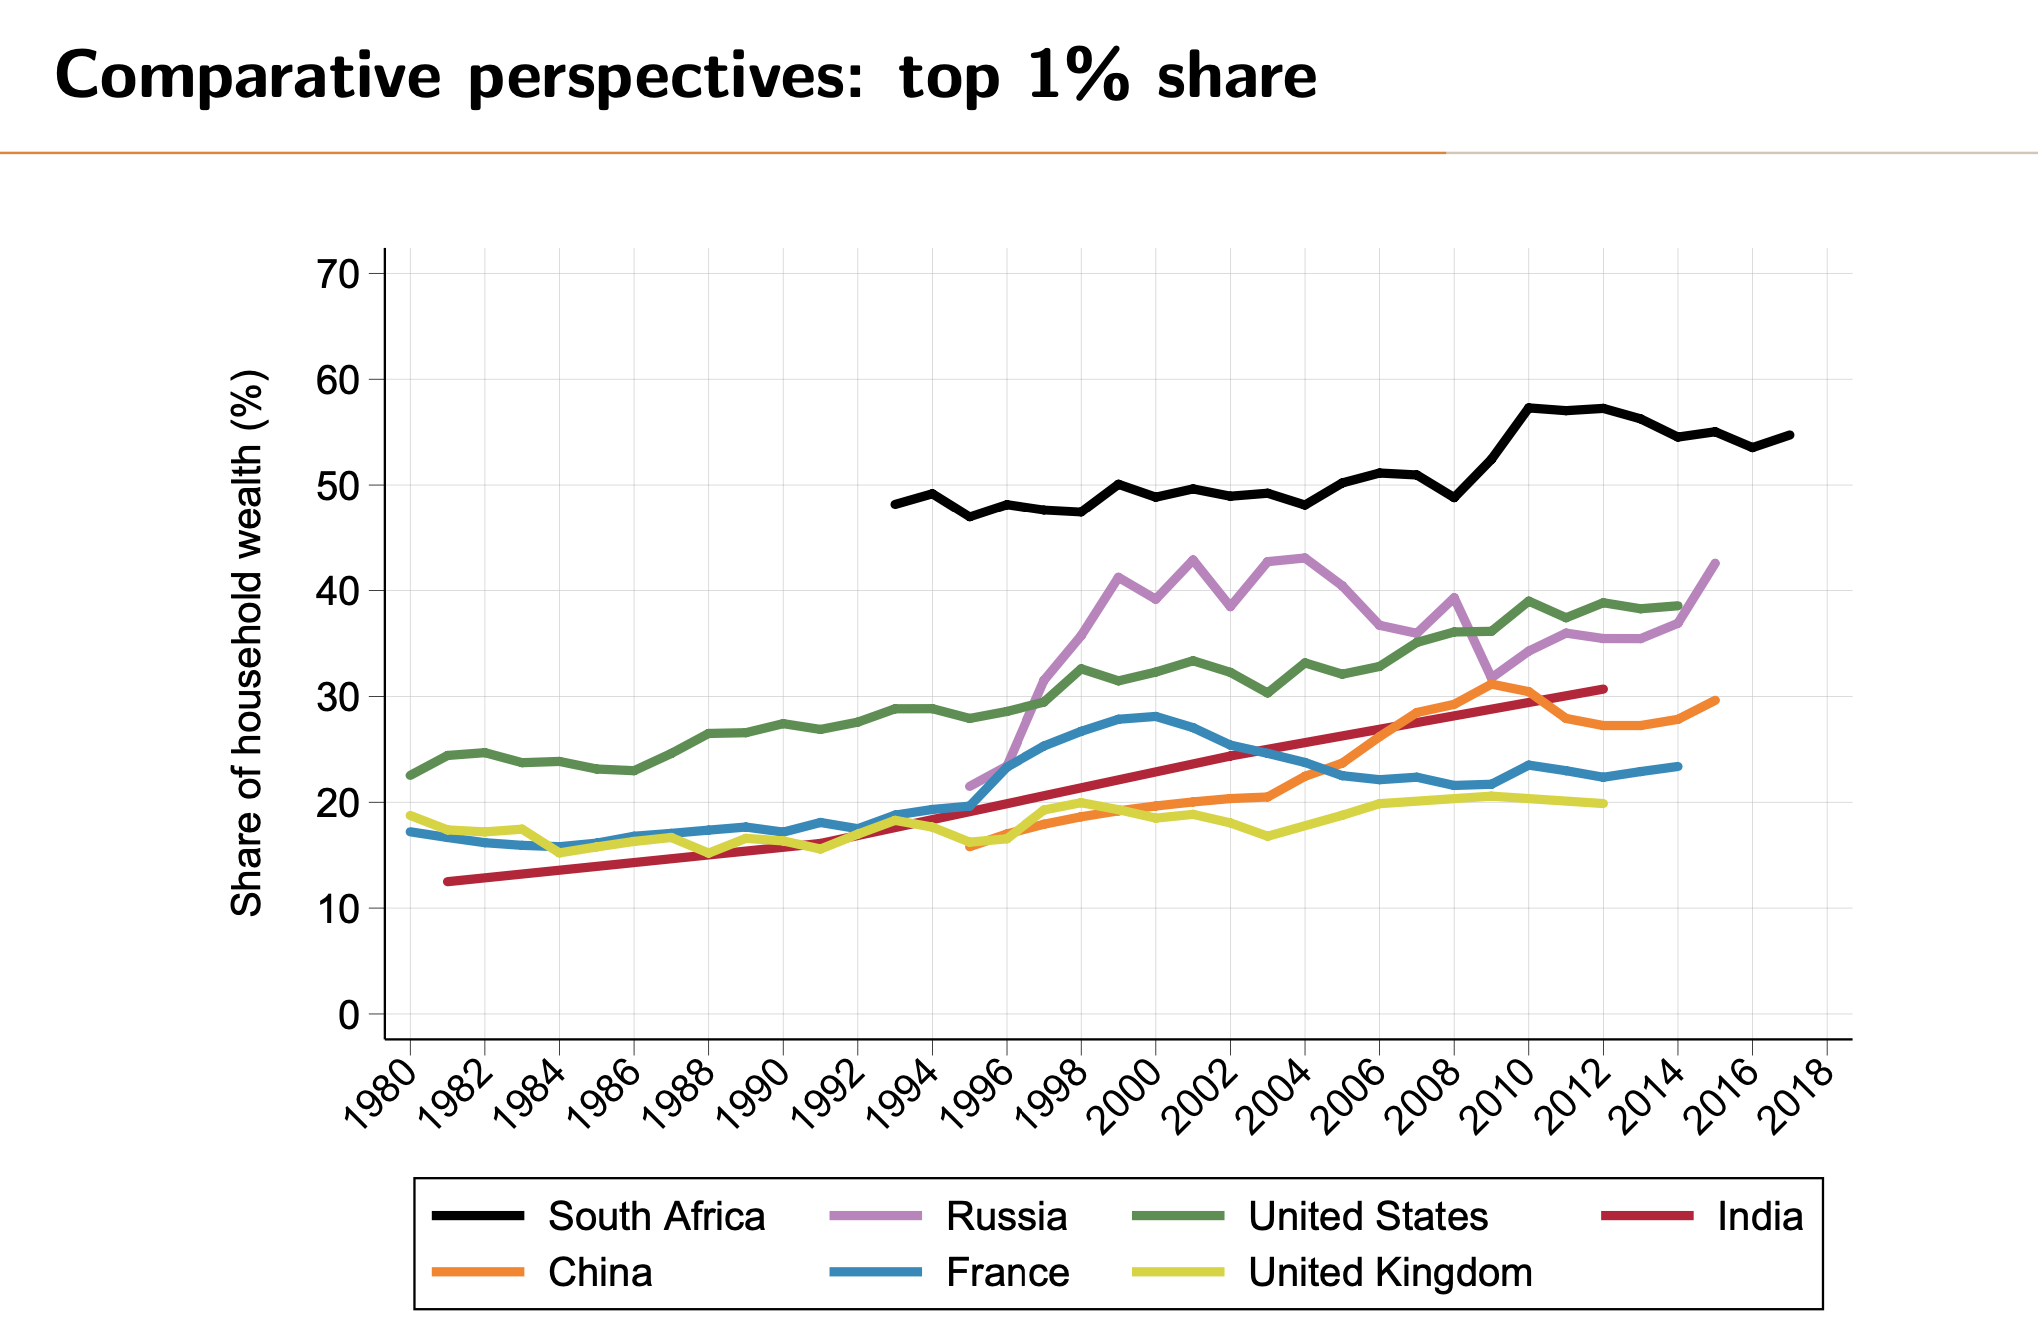
Chatterjee, Czajka, and Gethin’s approach allows wealth inequality in South Africa to be reasonably compared to other countries through the World Inequality Database. This tracks inequality measures, including wealth, using standardised methods across a growing number of countries.
South Africa has by far the most unequal distribution of wealth, with the USA a distant second. Chatterjee, Czajka, and Gethin conclude that “available data unanimously points to South Africa being one of the most unequal countries in the world, and even more so when looking at wealth rather than income.”
Published originally on GroundUp | © 2020 GroundUp